The Lorenz Attractor

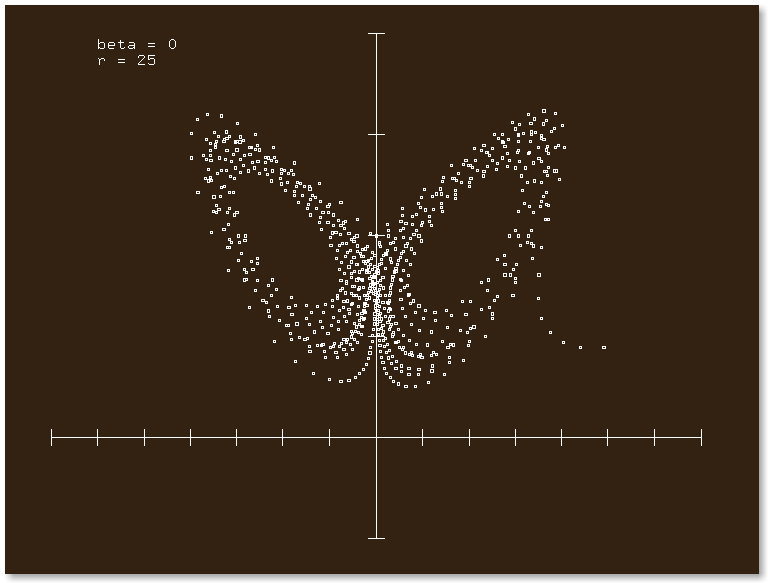
Here's a plot produced by our lorenz program, with the viewing angle β = 0 and the Rayleigh parameter r = 25. The x-axis is horizontal; the z-axis is vertical. For this plot, y = 0.
Note that this plot is initiated near x = 2.5, y = 0, z = 0.5. The subsequent trajectory of the plot is very sensitive to this initial position. The sign of x reverses at unpredictable times, and such times depend very sensitively on the position of the initial starting point.
This plot is a typical, and by now familiar representation of the Lorenz Attractor.

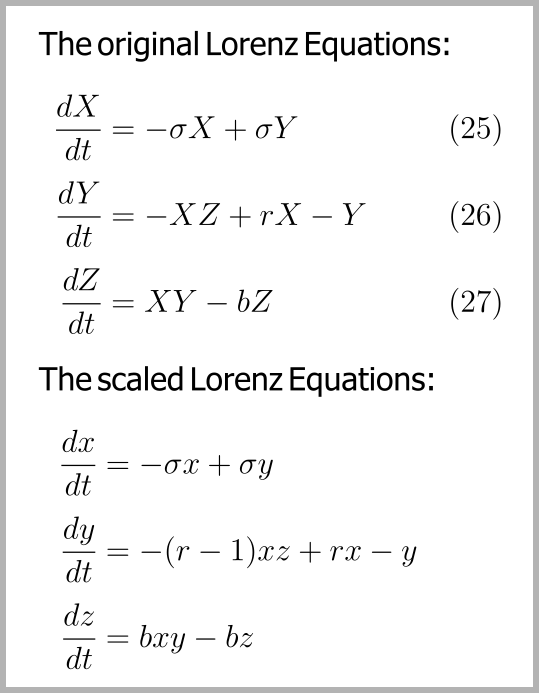
The first three equations in the white panel are those displayed by Lorenz in his famous paper. See Eqs. 25-27 on this paper's sixth page.
The lower three equations, which are those used in our program, are equivalent to Lorenz's original equations, but with the variables x, y and z simply scaled to ensure that the size of the plot does not grow or shrink when the Rayleigh parameter r is increased or decreased.
A tar file containing the source code for the lorenz program is available here. Written in C++, it is designed to be compiled and run primarily on Linux machines, for which the xterm terminal is available. (The lorenz program must be run from an xterm.) It may also be compiled and run on Windows machines, where it requires the installation of three Cygwin packages, but this is not difficult. Detailed instructions are included with the source code. I have yet to see whether it will run on a Mac.
I first wrote this program many years ago as an exercise. While a search on the internet will reveal several programs that illustrate the behavior of the Lorenz attractor, the program here has the unique feature that it allows the user to interact with it while it is running. It is thus designed to be educational. One may increase or decrease the Rayleigh Number, or change the viewing angle of the three-dimensional attractor, or select an initial point for the plotting of the attractor, all while the plotting is taking place. It's not a large program, and is easy to compile and run.